Security Compliance & KPI Dashboard
Security posture lived in four separate consoles — the SIEM, Qualys, EDR and PAM — and was stitched together by hand in spreadsheets for every management report. Nobody could say, on demand, which assets were compliant, which were drifting, or where remediation was overdue.
 Redacted · Confidential
The brief
JWPL’s security team had the data it needed; it just lived in four places. Vulnerability exposure sat in Qualys, detections in the LogRhythm SIEM, endpoint coverage in the EDR console and privileged-access coverage in PAM. Posture reporting meant exporting from each, reconciling asset names by hand, and pasting the results into a spreadsheet that was out of date the moment it was sent.
What I built
Per-source API clients. One modular Python client per vendor. Each handles that vendor’s token-based authentication, pagination and rate limits, and runs on a schedule so pulls are repeatable rather than one-off exports.
A shared data model. Every vendor names things differently, so each payload is normalised into one common schema covering assets, vulnerabilities, compliance checks and remediation records. The data lands in SQLite as point-in-time snapshots. That design choice is what makes trend lines possible: the dashboard can show how posture changes over time, not just what it looks like today.
KPIs with thresholds. Instead of static charts, each KPI is modelled against a defined threshold. Overdue remediation, tooling-coverage gaps (an asset Qualys knows about that EDR does not) and compliance drift across asset groups are flagged automatically.
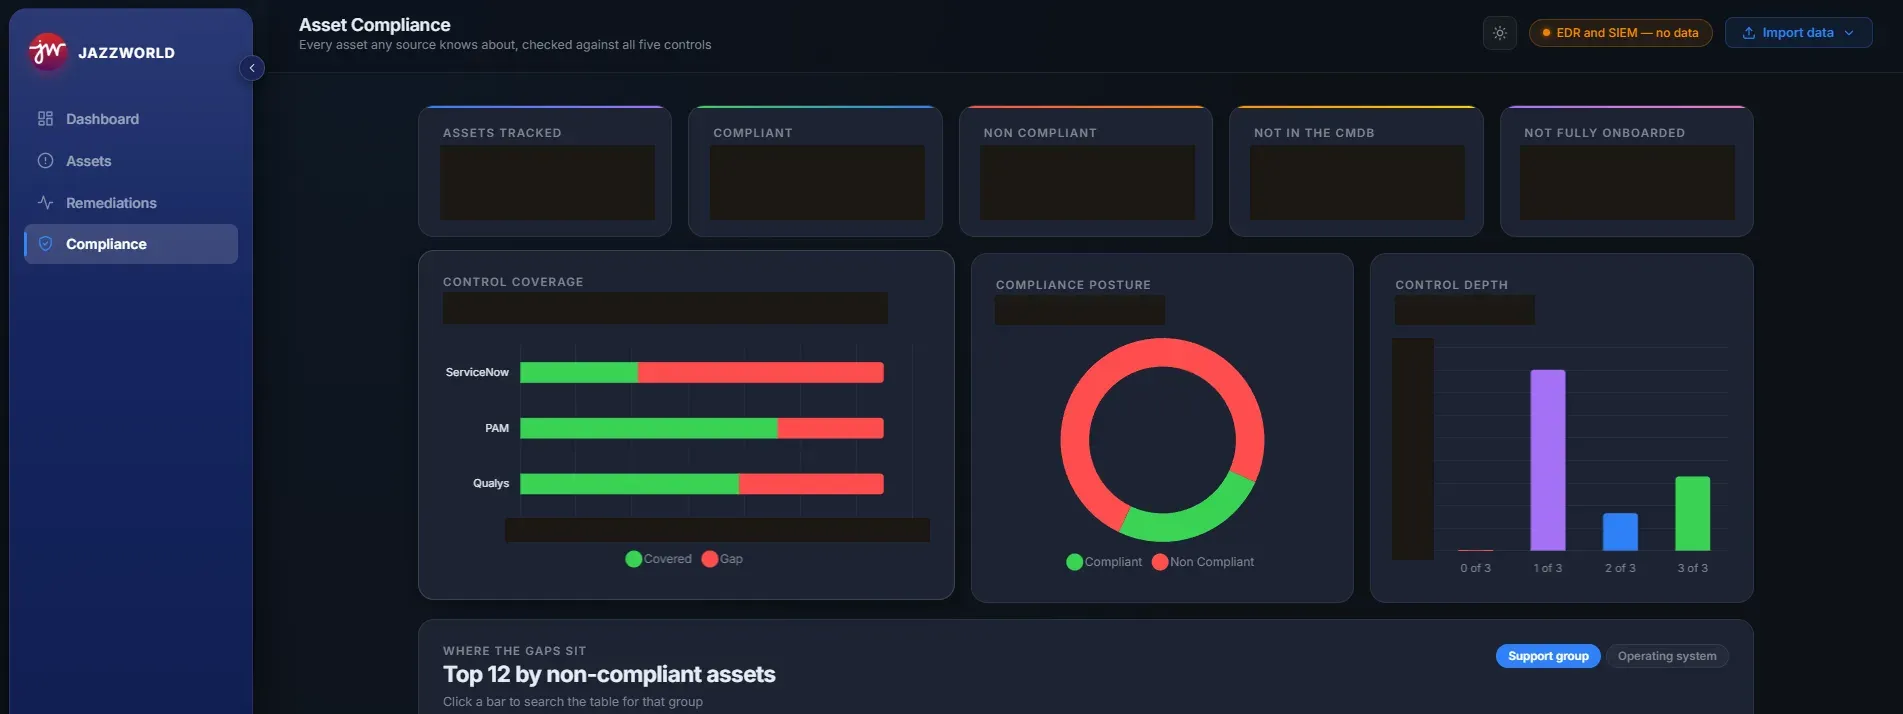
Views for two audiences. The views cover asset-criticality tiers, vulnerability-severity distribution, compliance coverage per control and remediation progress. That gives the security team a working tool and management a single source of truth for reporting.
Why the screenshots are redacted
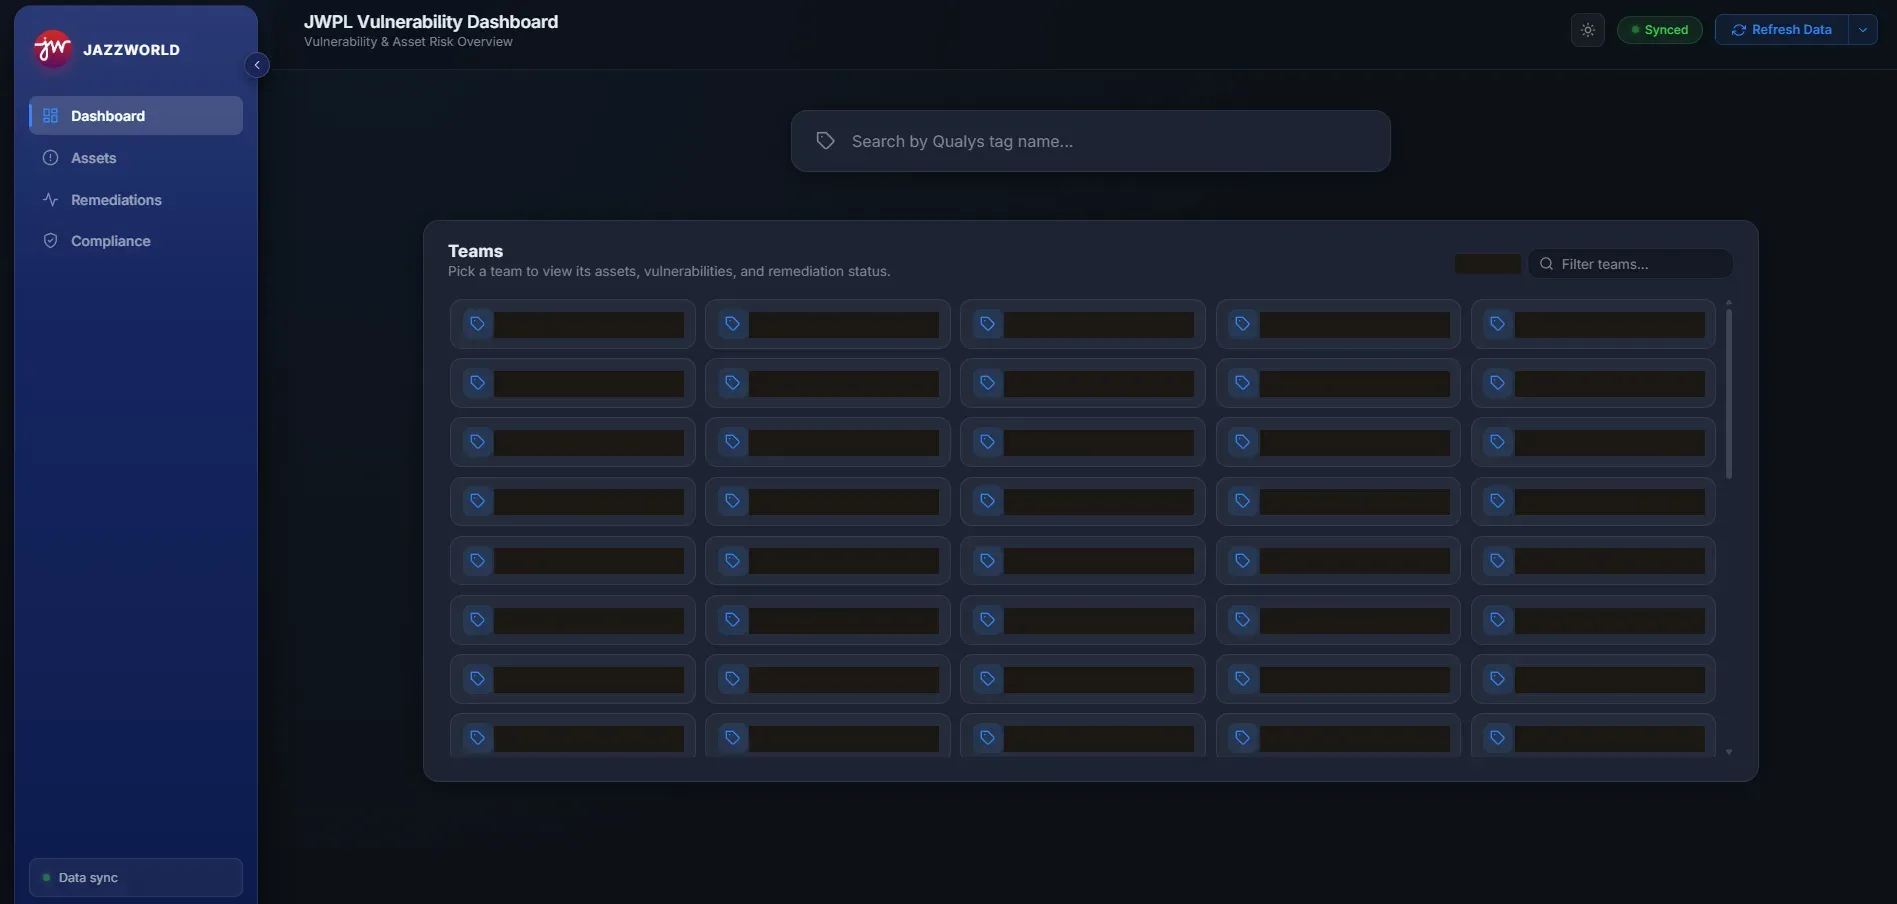
The dashboard ran on production data. Team names, asset counts and compliance percentages are internal to JWPL, so every value in these figures has been replaced with a solid bar. I used bars rather than blur because blurred text can sometimes be recovered.
What I’d do next
- Bring the EDR and SIEM feeds up to the same freshness as Qualys and PAM, so the “control depth” view reflects all five controls.
- Add alerting on threshold breaches, so the dashboard pushes drift to owners instead of waiting to be opened.
Architecture
Sources
- LogRhythm SIEM
- Qualys VM
- EDR
- PAM
Collect
- Python API clientstoken auth · pagination · rate limits · scheduled pulls
Normalise
- Common schemaassets · vulnerabilities · compliance checks · remediation
Store
- SQLitepoint-in-time snapshots for trend analysis
Decide
- KPI thresholdsoverdue remediation · coverage gaps · compliance drift
Report
- Dashboard viewscriticality · severity · control coverage · remediation progress
Evidence locker
 Redacted · Confidential